Multi-Modal Signal Analysis

Multi-Modal Signal Analysis

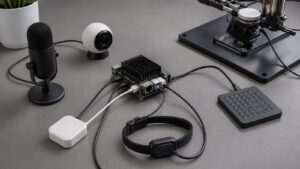
Multi-Modal Signal Analysis is where data becomes more than numbers—it becomes a conversation. Instead of relying on one type of input like audio or visuals alone, multi-modal systems blend multiple signal “voices” together to form a clearer understanding of the world. Think cameras working alongside microphones, motion sensors teaming with biometrics, or radar combining with environmental data to detect patterns that one channel could never reveal on its own. Here on Signal Streets, we explore how all these signals sync up, how machines interpret them, and how everyday experiences—from driving through smart intersections to wearing health-tracking devices—are powered by this teamwork of inputs. You don’t need to be a data scientist to appreciate the magic behind it. We’ll keep things simple, visual, and full of real examples. Whether you’re curious how your devices “see and hear” simultaneously or you want to experiment with combining signals in your own projects, this is your launch pad. Welcome to the front row of how smarter sensing actually happens!

Core Signals
1. Multi-modal signals mix inputs like sound, video, and motion together.
2. Each signal type sees part of the picture—together they see more.
3. Sensors collect tiny clues about what’s happening in real time.
4. Cameras track shapes and motion; microphones catch voices and noises.
5. Touch and pressure sensors measure contact and force.
6. A “fusion” system combines data into one shared understanding.
7. Better fusion = fewer mistakes in what the system decides.
8. Smart devices learn patterns that look the same across signals.
9. When one sensor struggles, others help fill in the gaps.
10. Multi-modal signals make tech feel more aware and helpful.
Data Bursts
1. Data often arrives in small packets called bursts.
2. Each burst captures a moment: what each sensor saw at that instant.
3. Matching bursts is important so signals line up in time.
4. If timing slips, the story gets blurry or confusing.
5. Sync markers help keep signals in step like a dance.
6. Cloud storage can hold huge libraries of bursts for analysis.
7. Filters can clean up noise before bursts get fused together.
8. Burst size depends on how fast signals change.
9. Compressing bursts helps devices save battery and bandwidth.
10. Visualizing bursts reveals how different sensors react to events.
Tech Toolshed
1. Multi-modal AI models help decode noisy real-world signals.
2. Dashboards show side-by-side charts for quicker insights.
3. Edge devices can fuse signals without sending all data to the cloud.
4. Simple Python tools help you explore signals at home.
5. Wearable kits mix heart rate data with motion tracking.
6. Microphone arrays capture sound direction—not just loudness.
7. Cameras with depth vision add distance to the picture.
8. Radar sensors detect motion behind walls or darkness.
9. Data labels help AI learn what signal patterns really mean.
10. Even low-cost sensors can reveal a lot when fused together.
Hidden Frequencies
1. Signals carry hidden rhythms inside their waves.
2. Different frequencies can represent motion, speech, or heartbeat.
3. A frequency jump can signal a sudden event.
4. Sensors may disagree—fusion helps sort truth from noise.
5. Combining waves can uncover new patterns in behavior.
6. Strong signals sometimes hide weak details underneath.
7. Zooming into a waveform can expose hidden clues.
8. Peaks and dips reflect changes in the environment.
9. Humans feel rhythms emotionally—machines quantify them.
10. Good analysis reveals the “heartbeat” of a system.
Waveform Wonders
1. Waveforms are shapes that show how signals change over time.
2. A smooth waveform can mean calm behavior.
3. A jagged waveform can mean sudden action or noise.
4. Comparing waveforms helps match causes and effects.
5. Video waveforms track brightness; audio waveforms track loudness.
6. Body sensors show waveforms for muscle movement and pulse.
7. Unexpected patterns can signal a problem early.
8. A drop in energy may mean the device is losing track.
9. Heat maps can display waveforms in 2D or 3D form.
10. Fun fact: we can “hear” some waveforms by playing them as sound!
Signal Sync FAQ’s
Q: Why mix multiple signal types?
A: It gives devices a fuller understanding of the world.
Q: Where is this used?
A: Smart cities, wearables, cars, robots, and home assistants.
Q: Does it need fast computers?
A: Yes, but small chips are getting really good at it.
Q: What if signals disagree?
A: Fusion logic picks what seems most reliable for the moment.
Q: Can regular people do this?
A: Absolutely—starter kits make it very doable.
Q: Is there a lot of math?
A: Behind the scenes, yes—front-end tools make it simple.
Q: How are signals labeled?
A: People tag events like “motion” or “speech” for AI to learn.
Q: What helps most for learning?
A: Lots of clean examples with clear outcomes.
Q: Can multi-modal reduce errors?
A: Yes—it’s great at fixing blind spots.
Q: What should I explore first?
A: Try adding audio to video or motion—fun and insightful!