Environmental Sensing

Environmental Sensing

Environmental sensing is how we give the planet a voice and turn its quiet changes into clear, readable signals. Every shift in temperature, gust of wind, trickle of water, or spike in noise can be captured by simple sensors and turned into data we can actually act on. On Signal Streets, this “Environmental Sensing” sub-category is your approachable guide to that world. We’ll explore sensors that watch air quality in busy cities, track soil moisture in gardens and farms, and monitor temperature, humidity, and light inside homes and buildings. No advanced math, no heavy jargon—just real examples, friendly visuals, and simple explanations. You’ll see how small sensor nodes can talk to each other, how dashboards turn scattered readings into maps and timelines, and how trends over days or months reveal the bigger picture. Whether you’re curious about climate, smart homes, clean air, or DIY field projects, “Environmental Sensing” helps you understand the signals around you—and use them to create safer, healthier, more responsive spaces.

Core Signals
1. Environmental sensing means measuring things like temperature, humidity, air quality, light, and noise in the world around us.
2. Small electronic sensors turn physical changes—like heat or gas levels—into electrical signals we can record and explore.
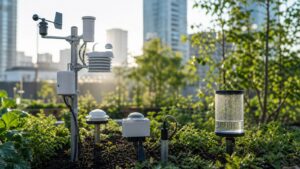
3. Simple examples include weather stations, indoor air monitors, soil probes, and noise meters on busy streets.
4. Each sensor focuses on one part of the environment, and together they build a bigger picture of what’s happening.
5. Readings are usually taken at regular time steps, so we can see how things change over minutes, days, or seasons.
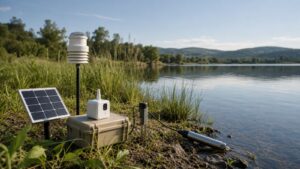
6. Many sensors live in “nodes,” small boxes that hold electronics, batteries, and sometimes solar panels.
7. These nodes often talk over Wi-Fi, cellular networks, or low-power radio links to send data back home.
8. Environmental sensing doesn’t have to be huge—small projects can cover a single room, backyard, or street.
9. The core idea is simple: listen carefully to the world, then turn those whispers into clear, shareable information.
10. Once you see your surroundings as signals, weather apps and dashboards suddenly make a lot more sense.
Data Bursts
1. Temperature sensors show how warm or cool it is, often in degrees Celsius or Fahrenheit.
2. Humidity sensors measure how much moisture is in the air, which affects comfort, mold risk, and equipment.
3. Air-quality sensors can estimate levels of tiny particles and gases that may affect breathing and long-term health.
4. Light sensors track brightness for plant growth, smart lighting, and energy-saving controls.
5. Noise sensors log sound levels over time, helping map quiet areas and noisy hotspots.
6. Soil moisture probes show how wet or dry the ground is, useful for gardens, farms, and landscaping.
7. Pressure sensors help weather stations track changes that signal storms or calmer conditions.
8. Simple counts—like how often values cross a threshold—can mark “alert” moments worth noticing.
9. Averages and daily highs/lows summarize how conditions feel overall, not just at one instant.
10. When many small measurements are logged together, they become rich stories about local climate and comfort.
Tech Toolshed
1. Starter sensor kits combine temperature, humidity, and light into one simple board for easy experiments.
2. Weather-station packages include wind, rain, and pressure sensors with mounting hardware for rooftops and poles.
3. Soil probes plug into small controllers, making it easy to log garden or greenhouse conditions.
4. Low-power microcontroller boards can run on batteries for months when set up carefully.
5. Data loggers store readings on memory cards so you can replay and analyze them later on a computer.
6. Cloud platforms accept sensor data over Wi-Fi or cellular and show live charts and maps in a browser.
7. Simple enclosure boxes protect electronics from rain, dust, and curious wildlife.
8. Calibration tools and reference meters help you check that sensors are reading reasonably.
9. Mapping tools turn scattered sensor points into color-coded maps you can share with others.
10. You can start tiny—a single sensor and a simple graph—and upgrade your tools as your projects grow.
Hidden Frequencies
1. Daily cycles show up as temperature and light curves that rise in the day and fall at night.
2. Weekly patterns may appear when human routines—like commuting or weekend events—change noise and air quality.
3. Slow seasonal shifts reveal how humidity, rainfall, and sunlight drift across months.
4. Short bursts in data can mark storms, traffic spikes, or equipment turning on and off.
5. Comparing indoor and outdoor readings shows how well buildings block heat, noise, or pollution.
6. Repeated dips in oxygen or spikes in CO₂ indoors can point to ventilation issues.
7. Coastal and hillside sensors may reveal patterns tied to wind direction and elevation.
8. Looking at long-term trend lines helps separate one-off events from real environmental changes.
9. Overlaying different signals—like temperature and noise—can uncover surprising relationships.
10. Many “hidden frequencies” only appear once you collect data patiently and look beyond a single day.
Waveform Wonders
1. Temperature over time looks like a gentle wave, rising with the sun and easing back after dark.
2. Rain events appear as sudden jumps in rainfall charts and often match drops in temperature.
3. Noise levels can show sharp peaks during rush hours and flatter sections late at night.
4. Air-quality waves may spike near busy roads, construction sites, or certain times of year.
5. Soil moisture graphs show slow declines between waterings, then steep jumps after rain or irrigation.
6. Light-intensity plots can reveal shading patterns from nearby trees or buildings.
7. Overlaying multiple waves helps you see how temperature, humidity, and comfort move together.
8. Zooming in shows small jitters and sensor noise; zooming out shows the broader rhythm.
9. Clean, simple line plots make it easier to explain findings to friends, neighbors, or teammates.
10. Once you get used to reading these waves, weather and environment feel less random and more understandable.
Signal Sync FAQ’s
Q: What is environmental sensing in simple terms?
A: It’s using sensors to measure the world around us—things like air, water, light, and noise.
Q: Do I need to be an engineer to start?
A: No. Many beginner kits and guides are designed for students, makers, and curious neighbors.
Q: Where can I place sensors?
A: On balconies, rooftops, gardens, windowsills, or inside rooms—just follow safety and local rules.
Q: How often should sensors record data?
A: It depends on your goal. Every minute is detailed; every 10–15 minutes works well for many projects.
Q: What about data quality?
A: Affordable sensors aren’t perfect, but they can still show useful trends and relative changes.
Q: Is this only for “big” climate projects?
A: Not at all. Local sensing can help with comfort, energy savings, gardening, and neighborhood awareness.
Q: How do I store and view my data?
A: You can log to memory cards, spreadsheets, or online dashboards that draw charts automatically.
Q: Are there privacy concerns?
A: Environmental data is usually less personal, but be mindful with microphones and cameras.
Q: Can I share my readings with others?
A: Yes. Many communities share open data to compare conditions and spot patterns together.
Q: What’s a good first project?
A: Start with temperature and humidity in one room or garden bed, then watch how they change across a week.