FFT and Fourier Transform Solve Related Signal Problems
The Fourier Transform and FFT are closely related, but they are not the same thing. The Fourier Transform is the mathematical idea that lets engineers describe a signal by its frequency content. The FFT, or Fast Fourier Transform, is an efficient algorithm for calculating that information on digital data. Both matter in signal processing because they help reveal tones, vibration, interference, repeating patterns, and hidden structure that may be difficult to see in the time waveform alone.
Fourier Transform Is the Concept
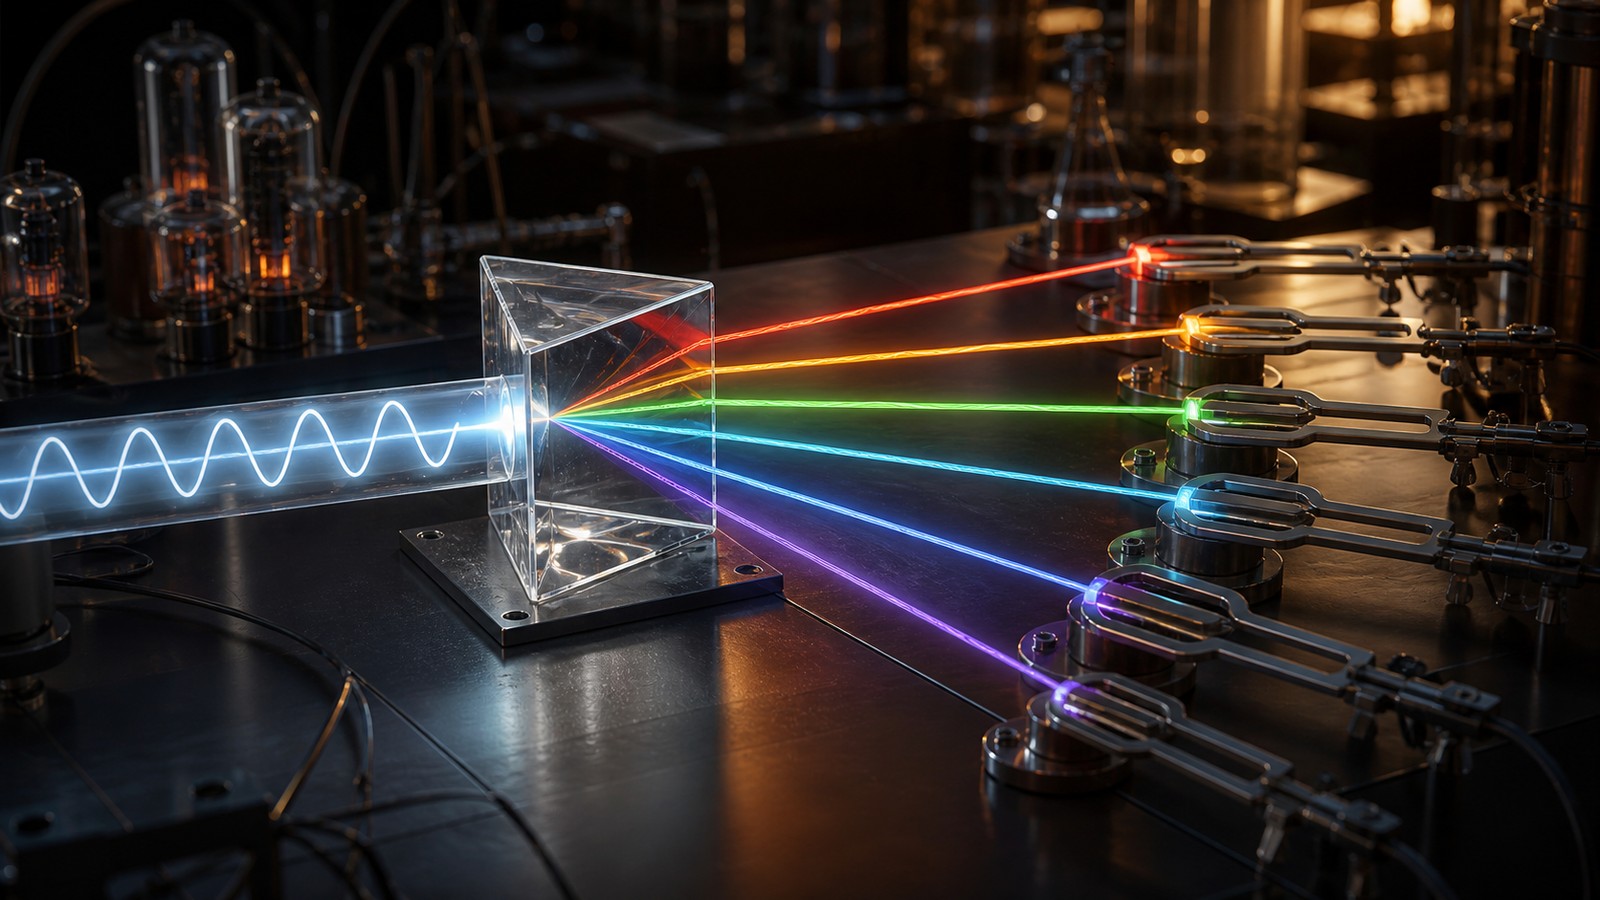
The Fourier Transform describes a signal in terms of frequency. Instead of asking only how the signal changes over time, it asks which frequencies are present and how strong they are.
This idea helps engineers see patterns that are hidden in the time view. A complicated waveform may be easier to understand when its frequency parts are separated.
FFT Is the Fast Method
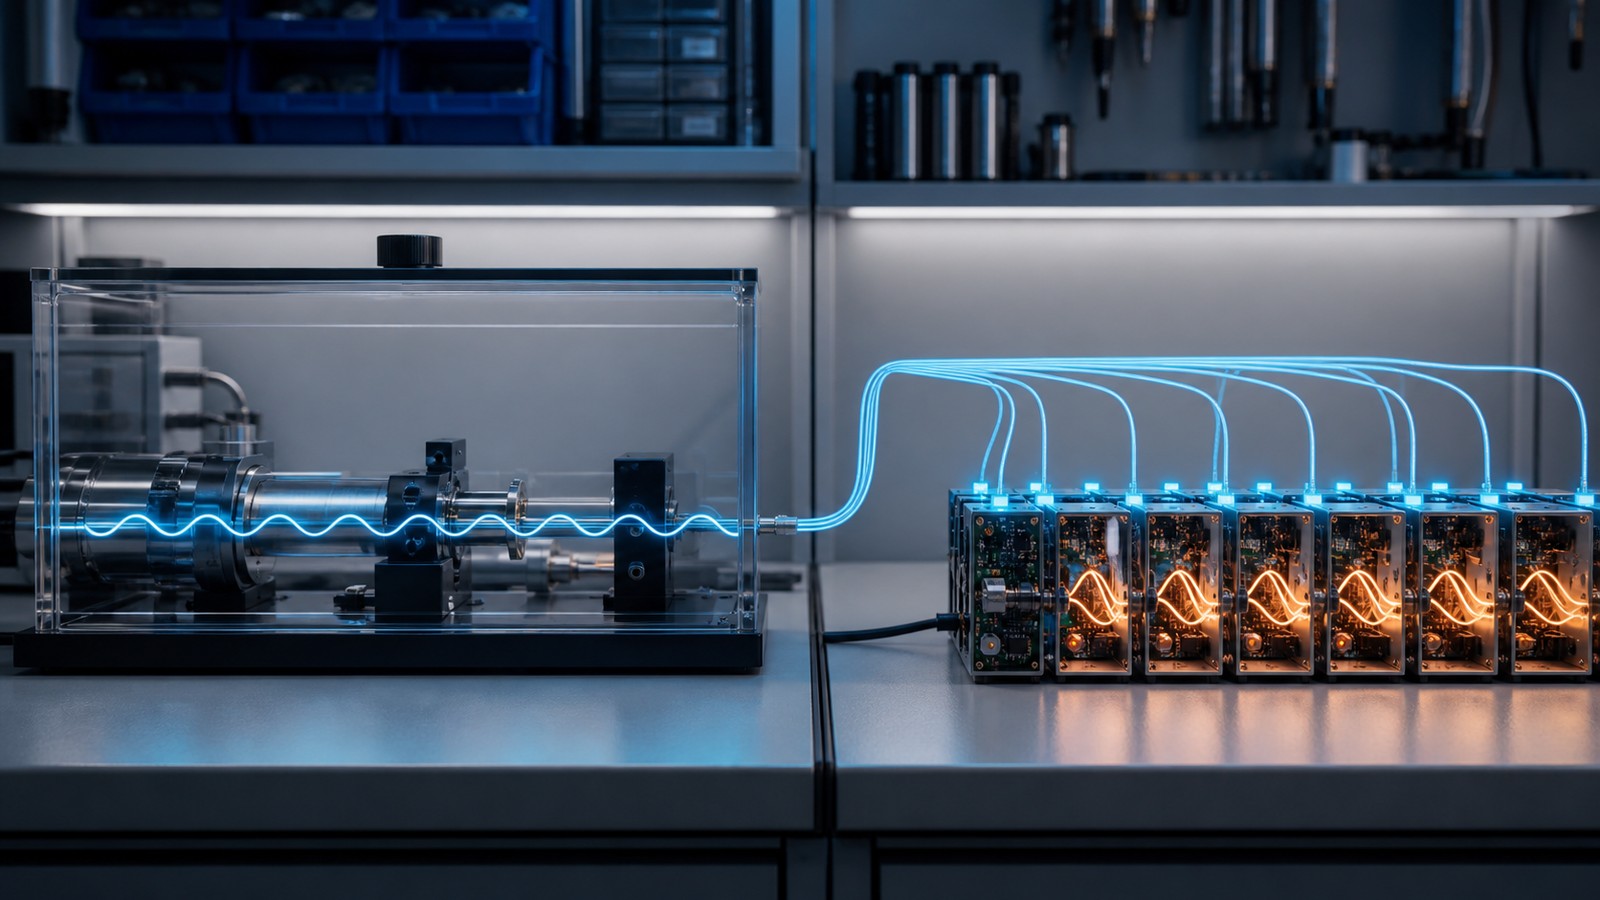
The FFT is a computational shortcut for calculating a discrete Fourier transform efficiently. It does not replace the concept; it makes the calculation practical.
Without fast algorithms, frequency analysis on large digital signals would be much slower. The FFT is one reason modern signal processing can run in real time.
Time View Shows Shape
The time-domain view shows how a signal changes from moment to moment. It is useful for seeing pulses, delays, bursts, steps, and sudden events.
Time view is often the first place engineers look. It shows when something happened, even if it does not clearly show which frequencies caused it.
Frequency View Shows Components
The frequency-domain view shows the signal as a set of frequency components. It can reveal tones, harmonics, noise bands, and interference.
This view is useful when the question is what frequencies are active. Audio, vibration, radio, and power signals all benefit from that perspective.
Discrete Data Needs Discrete Methods
Real digital systems work with sampled data. The discrete Fourier transform is used when the signal is represented by a finite list of samples.
The FFT calculates that discrete result efficiently. It is built for the sampled signals that computers and digital instruments actually process.
Sampling Affects the Result
The sample rate limits which frequencies can be represented. If sampling is too slow, high-frequency content may be lost or misread.
Engineers need to choose sampling carefully before using FFT results. Frequency analysis cannot recover detail that was never captured.
Window Length Changes Resolution
The number of samples used in an FFT affects frequency resolution. A longer window can separate closer frequencies, while a shorter window can track faster changes.
There is a tradeoff between timing and frequency detail. The right window depends on the signal and the decision being made.
Window Functions Reduce Leakage
Window functions shape the sampled segment before the FFT. They help reduce spectral leakage when a signal does not fit neatly inside the analysis window.
Choosing a window is part of practical FFT work. Different windows balance amplitude accuracy, leakage control, and frequency resolution.
Magnitude Shows Strength
FFT results often show magnitude, which tells how strong each frequency component is. This helps identify dominant tones or bands.
Magnitude is useful for comparing frequencies, but it should be read with scaling and window settings in mind. The chart is not automatically self-explanatory.
Phase Shows Timing Relationships
Fourier analysis can also include phase, which describes timing relationships between frequency components.
Phase matters in communications, control, audio alignment, and systems where signals combine. Ignoring phase can hide important behavior.
FFT Helps Find Interference
A wireless or electrical signal may contain unwanted frequency components from interference. The FFT can reveal those components more clearly than the raw waveform.
Once the frequency is visible, engineers can decide whether to filter, shield, move channels, adjust equipment, or investigate the source.
FFT Helps Vibration Analysis
Rotating machinery often produces vibration at frequencies tied to speed, bearings, gears, or imbalance.
FFT analysis can show those frequency patterns and help maintenance teams find early signs of wear or misalignment.
FFT Helps Audio Work
Audio tools use FFT analysis for equalizers, noise reduction, pitch detection, compression, and visualization.
The frequency view helps separate bass, midrange, treble, harmonics, and noise. It turns sound into a pattern that can be measured.
FFT Helps Power Systems
Power signals can contain harmonics and distortion that are hard to judge from a time waveform alone.
Frequency analysis helps engineers see whether the waveform contains unwanted components that may affect equipment or efficiency.
FFT Output Needs Interpretation
An FFT plot can look precise, but interpretation still requires context. Peaks, noise floors, leakage, and sampling choices all affect the result.
Engineers should connect the plot back to the physical system. A frequency peak is evidence, not a complete explanation by itself.
What to Check Next
Teams should check sample rate, window length, scaling, window function, and the signal question before trusting FFT results.
They should also compare frequency findings with time-domain behavior. Both views often matter together.
Deployment Notes
Real-time FFT systems need enough compute power, stable sampling, and clear thresholds. Poor setup can create misleading alerts.
Stored analysis should record settings so results can be reproduced later. Frequency evidence is stronger when the method is documented.
Practical Review
The practical review asks whether the FFT made a hidden pattern easier to find. If it did not change diagnosis or action, the analysis may need a sharper purpose.
A good result points toward a frequency, source, trend, or next test. That is where frequency analysis becomes useful.
Common Mistakes
A common mistake is treating FFT output as absolute truth without checking sampling and window settings. Another is ignoring short events that are blurred by a long window.
Avoiding these mistakes takes practice. The method is powerful, but it rewards careful setup.
Final Takeaway
The Fourier Transform is the frequency-analysis idea, while the FFT is the efficient digital method that makes it practical.
Together they help engineers move between time and frequency views so hidden signal structure becomes easier to inspect.
FFT Is Common Because It Is Efficient
The FFT became common because it makes frequency analysis fast enough for practical use. Audio tools, radios, instruments, and monitoring systems can calculate frequency content quickly.
That efficiency changes what engineers can do. Frequency analysis can run continuously instead of only after slow offline processing.
Resolution Tradeoffs Need Care
A longer FFT can reveal fine frequency differences, but it may react slowly to brief changes. A shorter FFT can follow time changes but may blur nearby frequencies.
This tradeoff is one of the central practical decisions in FFT work. The analysis should match the signal behavior.
FFT Results Should Be Scaled Clearly
Scaling affects how magnitudes appear in an FFT result. Two tools may show different-looking values from the same signal if their scaling differs.
Clear scaling helps teams compare results. It also prevents overreacting to chart differences caused by settings rather than signal changes.
Frequency Analysis Works Best With Context
A frequency peak needs context before it becomes a diagnosis. The same frequency may mean a tone, harmonic, interference source, rotating part, or analysis artifact.
Engineers should connect the frequency to the system. That connection turns a plot into evidence.
Final FFT Review
Before relying on an FFT result, teams should ask what signal was sampled, how it was windowed, and what question the frequency view is supposed to answer.
After review, the FFT should point to a clearer next step: filter, inspect, compare, monitor, or adjust.
FFT Is Not a Different Transform
A common misunderstanding is thinking the FFT is a separate kind of transform. It is better understood as a fast way to compute the discrete Fourier transform.
That distinction helps avoid confusion. The math goal is frequency analysis; the FFT is the efficient route to the answer.
Digital Instruments Depend on FFT
Oscilloscopes, spectrum analyzers, audio tools, vibration monitors, and radio tools often use FFT calculations behind the scenes.
The user may see a spectrum display, but the device is doing fast digital math on sampled data. Understanding this helps engineers read the display more carefully.
Bin Spacing Affects Peak Location
FFT output is divided into frequency bins. The spacing between bins depends on sample rate and FFT length.
A real signal frequency may fall between bins, so the peak may spread or appear slightly shifted. This is one reason resolution matters.
Zero Padding Changes Display
Zero padding adds zeros to the sampled segment before the FFT. It can make the plotted spectrum look smoother, but it does not create new measured information.
This distinction matters in interpretation. A smoother chart is not the same as higher true resolution.
Averaging Can Stabilize Spectra
FFT results can vary from one window to the next when noise or changing signals are present. Averaging several spectra can make stable patterns easier to see.
Averaging also hides short-lived events. Engineers should choose it when the goal is stable frequency content rather than brief bursts.
Real-Time FFT Needs Latency Choices
Real-time systems must decide how much data to collect before each FFT. More data improves frequency detail but adds delay.
This matters in monitoring and control. A system should not wait too long if the goal is fast detection.
FFT Supports Filtering Decisions
Frequency analysis often guides filter design. Engineers can see which bands should be preserved and which should be reduced.
The FFT does not design the whole filter by itself, but it gives evidence for choosing cutoff frequencies, notch frequencies, or smoothing approaches.
FFT Should Be Compared Over Time
Repeated FFT results can show whether a frequency component is growing, shrinking, moving, or appearing only under certain conditions.
Trend review is useful in vibration, interference, audio, and power monitoring. A single spectrum is a snapshot; a series of spectra tells a story.
Practical Settings Should Be Saved
Important FFT results should be saved with sample rate, window type, FFT length, overlap, scaling, and sensor information.
Without those settings, later teams may not be able to reproduce the result. Documentation turns a chart into evidence.
Final FFT Takeaway
FFT work is strongest when the calculation settings match the signal question. Fast math does not remove the need for engineering judgment.
Used carefully, the FFT gives engineers a practical bridge between raw waveforms and frequency evidence.
FFT Helps Compare Before and After
FFT analysis is useful when teams compare a signal before and after a change. A filter, repair, shielding change, or configuration update should change the spectrum in a visible way.
This before-and-after review helps prove whether the action worked. It also catches cases where a fix moved the problem instead of solving it.
Sensor Choice Affects FFT Results
The FFT can only analyze what the sensor captures. A poor microphone, accelerometer, probe, or receiver can distort the frequency evidence.
Sensor bandwidth, placement, calibration, and noise floor all matter. Frequency analysis starts with measurement quality.
Overlap Can Improve Tracking
Some FFT systems use overlapping windows so the analysis updates more smoothly over time.
Overlap can improve monitoring, but it increases processing and can make outputs appear more continuous than the independent evidence really is. Settings should be documented.
FFT Alerts Need Clear Thresholds
An FFT-based alert should define which frequency, band, or pattern triggers action. Vague spectral warnings are hard to respond to.
Clear thresholds help responders know whether the issue is a tone, harmonic, noise band, or broad spectrum change.
FFT Is a Diagnostic Tool
The FFT is best treated as a diagnostic tool, not a magic answer. It reveals frequency structure so engineers can form better hypotheses.
Those hypotheses still need confirmation through inspection, filtering, comparison, or another measurement.
Better Analysis Uses Both Views
Strong signal work often combines time plots, FFT plots, spectrograms, and operating context.
Each view answers a different question. Together they make it easier to understand what changed, when it changed, and what frequencies were involved.