Fourier Transform Shows the Frequencies Inside a Signal
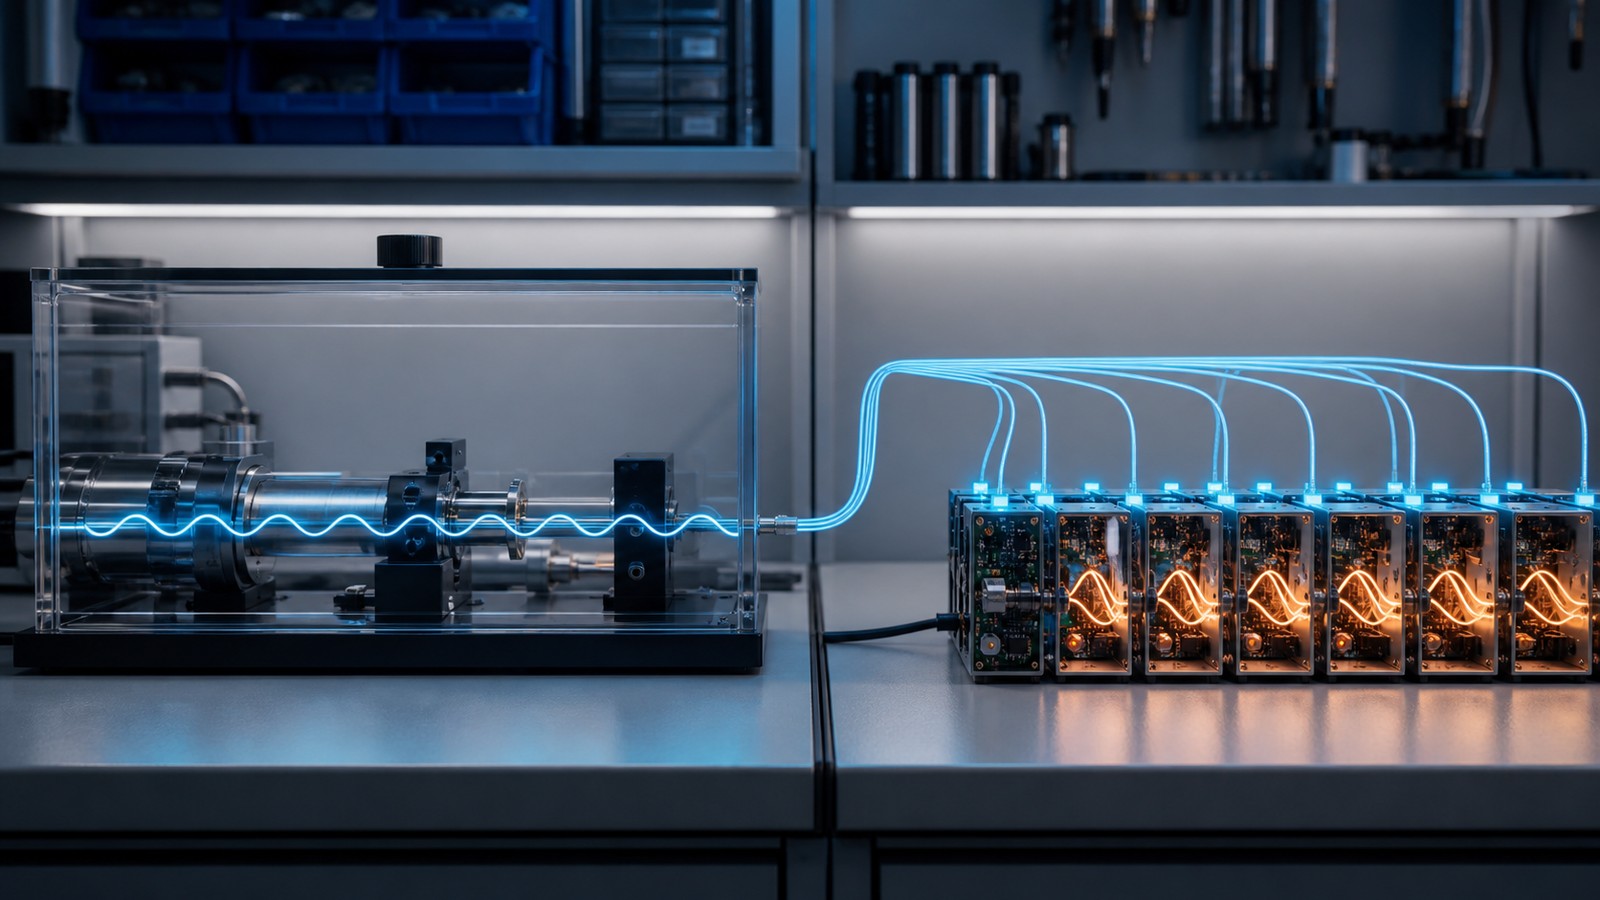
The Fourier Transform explains how a signal can be viewed as a combination of frequencies. A waveform may look complicated over time, but it can often be understood as a mixture of slow changes, fast oscillations, tones, harmonics, and noise. This frequency view helps engineers analyze audio, radio, vibration, power, biomedical signals, images, and many other data streams. It does not replace the time view; it gives another way to understand what the signal contains.
Signals Can Be Decomposed
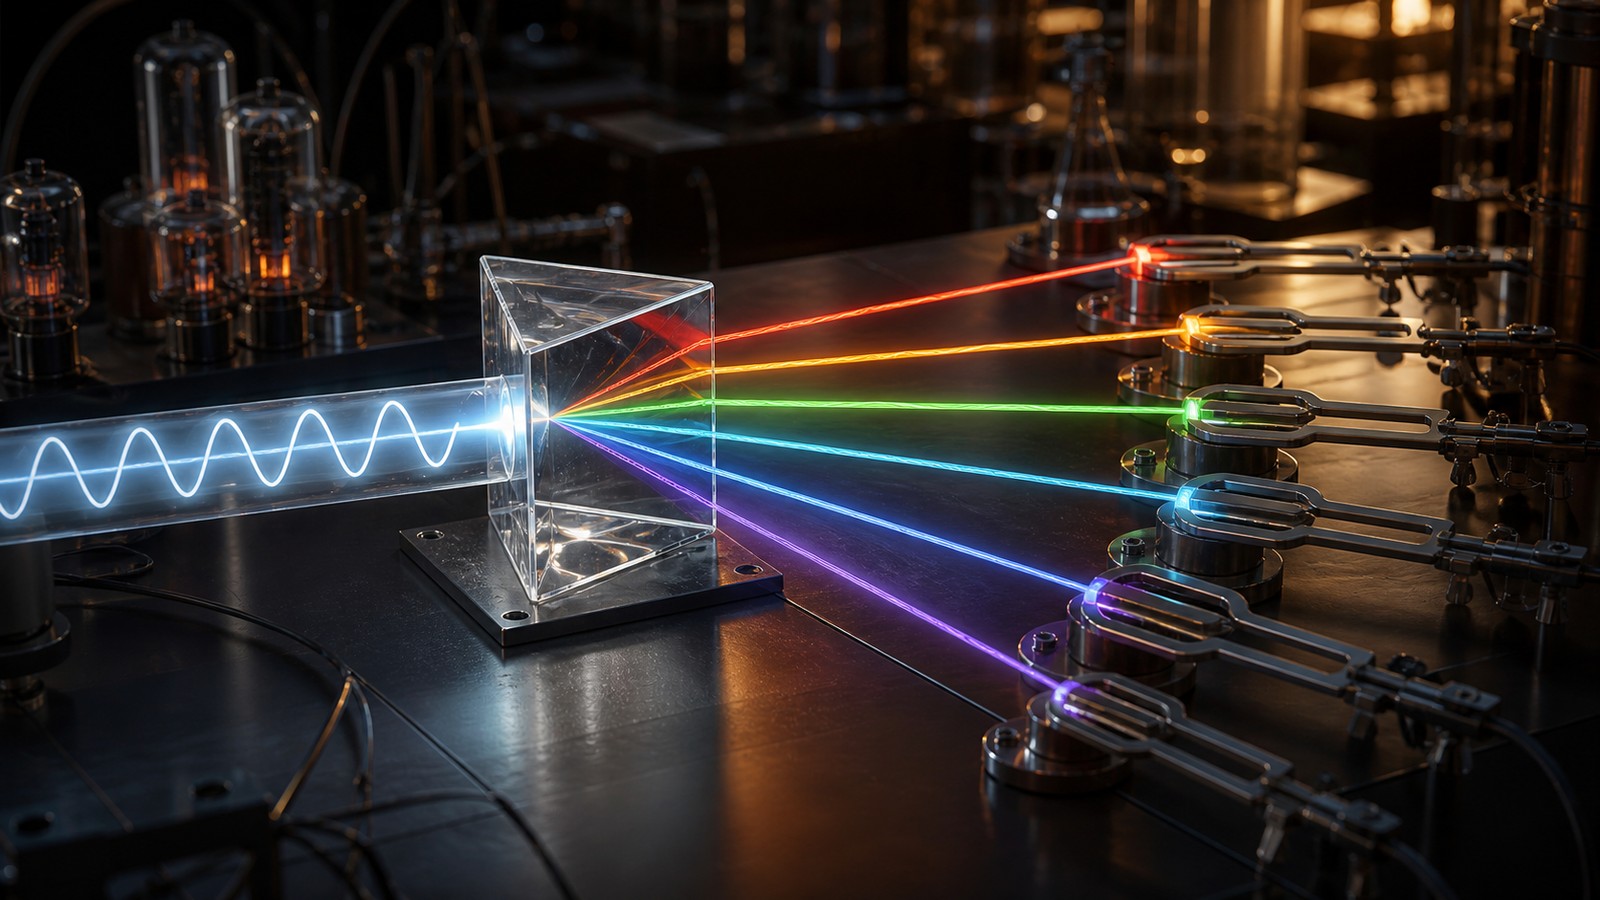
Fourier analysis starts with the idea that many signals can be represented as combinations of sine and cosine waves.
Those simple waves act like building blocks. The transform describes how much of each frequency is present.
Time Domain Shows Events
The time domain shows when the signal rises, falls, spikes, repeats, or changes shape.
This is useful for timing questions. It tells when something happened but may not reveal the frequency makeup clearly.
Frequency Domain Shows Content
The frequency domain shows the signal by frequency content. It reveals low-frequency drift, high-frequency noise, repeating tones, and harmonic structure.
This view can simplify complicated waveforms. A messy time signal may contain a few important frequency parts.
Low Frequencies Change Slowly
Low-frequency components represent slow changes in the signal. They may show trends, baseline drift, or gradual motion.
These components are important in temperature, pressure, motion, and many control systems. Slow does not mean unimportant.
High Frequencies Change Quickly
High-frequency components represent fast changes. They may show sharp edges, noise, vibration, switching behavior, or fine detail.
High-frequency content can be useful or unwanted depending on the system. The transform helps engineers decide which is which.
Harmonics Reveal Structure
Harmonics are frequencies related to a fundamental frequency. They appear in music, power systems, vibration, and many periodic signals.
Harmonics can reveal tone quality, distortion, mechanical behavior, or electrical problems. They are often easier to see in frequency view.
Noise Becomes Easier to See
Noise may appear as broad frequency content or energy in bands where it should not be.
Fourier analysis helps locate noise and decide whether filtering, shielding, smoothing, or better measurement is needed.
Filtering Uses Frequency Insight
Filters often work by keeping or reducing certain frequency ranges. Fourier analysis helps engineers know which frequencies to target.
A low-pass, high-pass, band-pass, or notch filter makes more sense when the signal’s frequency content is visible.
Amplitude Matters
The transform can show how strong each frequency component is. This helps compare dominant and minor parts of the signal.
Amplitude should be interpreted with the analysis settings. Scaling, windowing, and sample length can affect what the chart shows.
Phase Matters Too
Phase describes how frequency components line up in time. It can affect how signals combine or cancel.
Phase is important in communications, audio, control, and systems where timing relationships matter.
Sampling Sets Limits
Digital Fourier analysis depends on sampled data. The sample rate determines the highest frequency that can be represented correctly.
If sampling is too slow, aliasing can make high-frequency content appear as a false lower frequency. This can mislead analysis.
Windows Shape the View
When engineers analyze a slice of signal, the chosen window affects the frequency result.
Window functions reduce leakage and shape tradeoffs between resolution and amplitude accuracy. They are part of careful analysis.
Resolution Needs Enough Data
Frequency resolution improves when the analysis includes more time samples. A longer record can separate frequencies that are close together.
The tradeoff is that long windows blur timing. Engineers choose the window based on the question.
Fourier Transform Supports Audio
In audio, Fourier analysis helps with equalization, pitch, noise reduction, compression, and visualization.
It gives engineers and tools a way to separate sound by frequency instead of treating it as one combined waveform.
Fourier Transform Supports Radio
In radio and wireless systems, frequency analysis helps identify channels, bandwidth, modulation, interference, and spectral shape.
This is central to understanding how signals share spectrum and how unwanted energy affects communication.
Fourier Transform Supports Machines
Machine vibration often contains frequency patterns tied to rotating parts, bearings, belts, or imbalance.
Frequency analysis helps maintenance teams see mechanical clues before they are obvious in the raw waveform.
What to Check Next
Teams should check sampling, signal length, windowing, scaling, and whether the question is about timing, frequency, or both.
They should also compare the transform result with the physical system. Frequency peaks need real-world interpretation.
Deployment Notes
Fourier analysis in deployed systems needs documented settings and repeatable processing. Otherwise, results can change for reasons unrelated to the signal.
Teams should store enough context to reproduce important results and explain alerts later.
Practical Review
A practical review asks which frequencies matter and why. The transform is useful when it points toward a filter, diagnosis, classification, or next measurement.
It should not become a decorative plot. The frequency view should support action.
Final Takeaway
The Fourier Transform moves a signal from time view to frequency view so engineers can inspect the parts inside the waveform.
It is most useful when paired with sampling discipline, physical context, and a clear signal question.
Transforms Support Many Domains
Fourier ideas appear in audio, wireless communication, radar, imaging, vibration, power, and scientific measurement.
The same basic idea adapts because many systems contain repeating or frequency-based structure. The details change, but the frequency view remains useful.
Inverse Transform Rebuilds the Signal
The inverse Fourier Transform moves frequency information back into a time-domain signal.
This matters because engineers often analyze in frequency, modify the content, and return to time view. Filtering is a common example.
Frequency Analysis Can Mislead
A frequency plot can mislead if sampling, windowing, scaling, or sensor quality is poor.
The transform is a tool, not a guarantee. It should be used with knowledge of how the signal was captured.
Time and Frequency Work Together
The time view and frequency view answer different questions. Time shows when, while frequency helps show what kind of repeating content is present.
Good analysis often uses both. Engineers move back and forth until the signal behavior makes sense.
Final Transform Review
A final review should ask whether frequency analysis clarified the signal or only added another chart.
The transform earns its place when it supports diagnosis, filtering, classification, compression, or better measurement.
Fourier Thinking Explains Filters
Filters make more sense when viewed through Fourier thinking. A filter changes the frequency content of a signal, even when the user sees the result in time view.
This explains why smoothing can reduce high-frequency noise and why a notch filter can remove a narrow interference tone.
Sharp Changes Need High Frequencies
A sudden edge, pulse, or impact requires high-frequency components to describe it accurately.
If those components are filtered away, the signal may look smoother but less precise. That tradeoff matters in measurement and control.
Periodic Signals Are Easier to Interpret
Periodic signals often produce clear frequency peaks. A repeating tone, rotating shaft, or alternating current waveform can be easier to inspect in frequency view.
Nonperiodic signals can still be analyzed, but the interpretation may require windows, time-frequency methods, or additional context.
Frequency View Helps Compression
Compression often depends on representing signals efficiently. Frequency-domain thinking helps identify parts that can be stored, reduced, or ignored depending on the application.
Audio, images, and many data formats rely on related ideas. They exploit structure so fewer bits can represent the useful signal.
Fourier Analysis Supports Images Too
Images can be treated as signals that change across space rather than time. Frequency ideas help describe edges, textures, blur, and repeated patterns.
This shows that Fourier thinking is broader than sound or radio. It is a general way to analyze variation.
Resolution Is a Practical Choice
Frequency resolution is not free. More resolution often requires longer data segments, more processing, or less timing detail.
Engineers choose the balance based on whether they need to separate close frequencies or track fast-changing behavior.
Measurement Units Should Be Clear
Fourier results should be labeled with clear units, scaling, and context. Otherwise, users may compare plots that are not comparable.
Good labeling matters in reports and dashboards. It helps prevent false conclusions from display choices.
Transform Results Need Validation
A frequency result should be validated against known signals, physical expectations, or independent measurements when possible.
Validation builds trust. It confirms that the frequency peak or noise band reflects the system rather than the analysis setup.
Practical Fourier Takeaway
Fourier analysis is useful because it separates hidden frequency structure from a signal that may look confusing in time view.
The method becomes strongest when the frequency result points to a real engineering decision.
Frequency Peaks Need Cause
A frequency peak is a clue, not a cause by itself. It may come from a real source, a harmonic, a sensor artifact, leakage, or an analysis setting.
Engineers should ask what physical process could create the peak. That question keeps the transform connected to reality.
Broadband Energy Means Something Different
Not all frequency content appears as a narrow peak. Broadband energy can indicate noise, rough motion, turbulence, impacts, or complex signals.
Reading broadband energy requires context. It may call for filtering, better shielding, or a closer look at the measurement setup.
Time-Frequency Tools Add Detail
Some signals change frequency over time. A single Fourier Transform over a long window may hide that movement.
Spectrograms and related tools help show how frequency content evolves. They are useful for speech, music, machinery, radar, and changing wireless signals.
Transform Choice Depends on the Question
Fourier analysis is powerful, but it is not the only transform or signal method. Some tasks may need wavelets, short-time analysis, filters, or statistical features.
The right method depends on the signal question. Fourier tools are strongest when frequency content is central.
Practical Examples Build Intuition
A pure tone creates a focused frequency component, while a click spreads energy across many frequencies. A slow drift appears near low frequencies, while hiss appears broadly at higher frequencies.
These examples help readers connect the chart to sound, motion, radio, or electrical behavior. Intuition matters because plots can otherwise feel abstract.
Engineering Use Requires Repeatability
Fourier analysis should produce repeatable results when the same signal and settings are used. If results change unexpectedly, the setup needs review.
Repeatability makes frequency analysis trustworthy. It lets teams compare tests, repairs, sites, and model versions.
Final Frequency Takeaway
The Fourier Transform is useful because many signals become easier to understand when their frequency parts are visible.
The strongest use combines mathematical care with practical knowledge of the system being measured.
Frequency Results Should Guide Action
Frequency analysis should lead to a decision such as choosing a filter, checking a component, changing a channel, improving a sensor, or comparing two operating states.
This action link keeps the transform practical. A beautiful spectrum is less valuable than a clear next test.
Physical Limits Still Apply
Fourier analysis cannot fix poor measurement. If the sensor misses a frequency, clips the signal, or records too much noise, the transform will reflect those limits.
Good analysis starts before the calculation. It begins with the right sensor, sample rate, and measurement setup.
Frequency Thinking Builds Better Models
AI models often benefit when Fourier-based features are included. Frequency bands, harmonic strength, and spectral shape can all become useful inputs.
Those features should be tested against outcomes. The frequency view is valuable when it improves prediction, detection, or explanation.
A Clear Method Builds Trust
Teams should record how frequency analysis was done. Sample rate, windowing, scaling, and filtering choices all affect the result.
A clear method lets another engineer reproduce the finding. That is what turns signal analysis into reliable evidence.