Time-Series Data Tracks Signals in Order
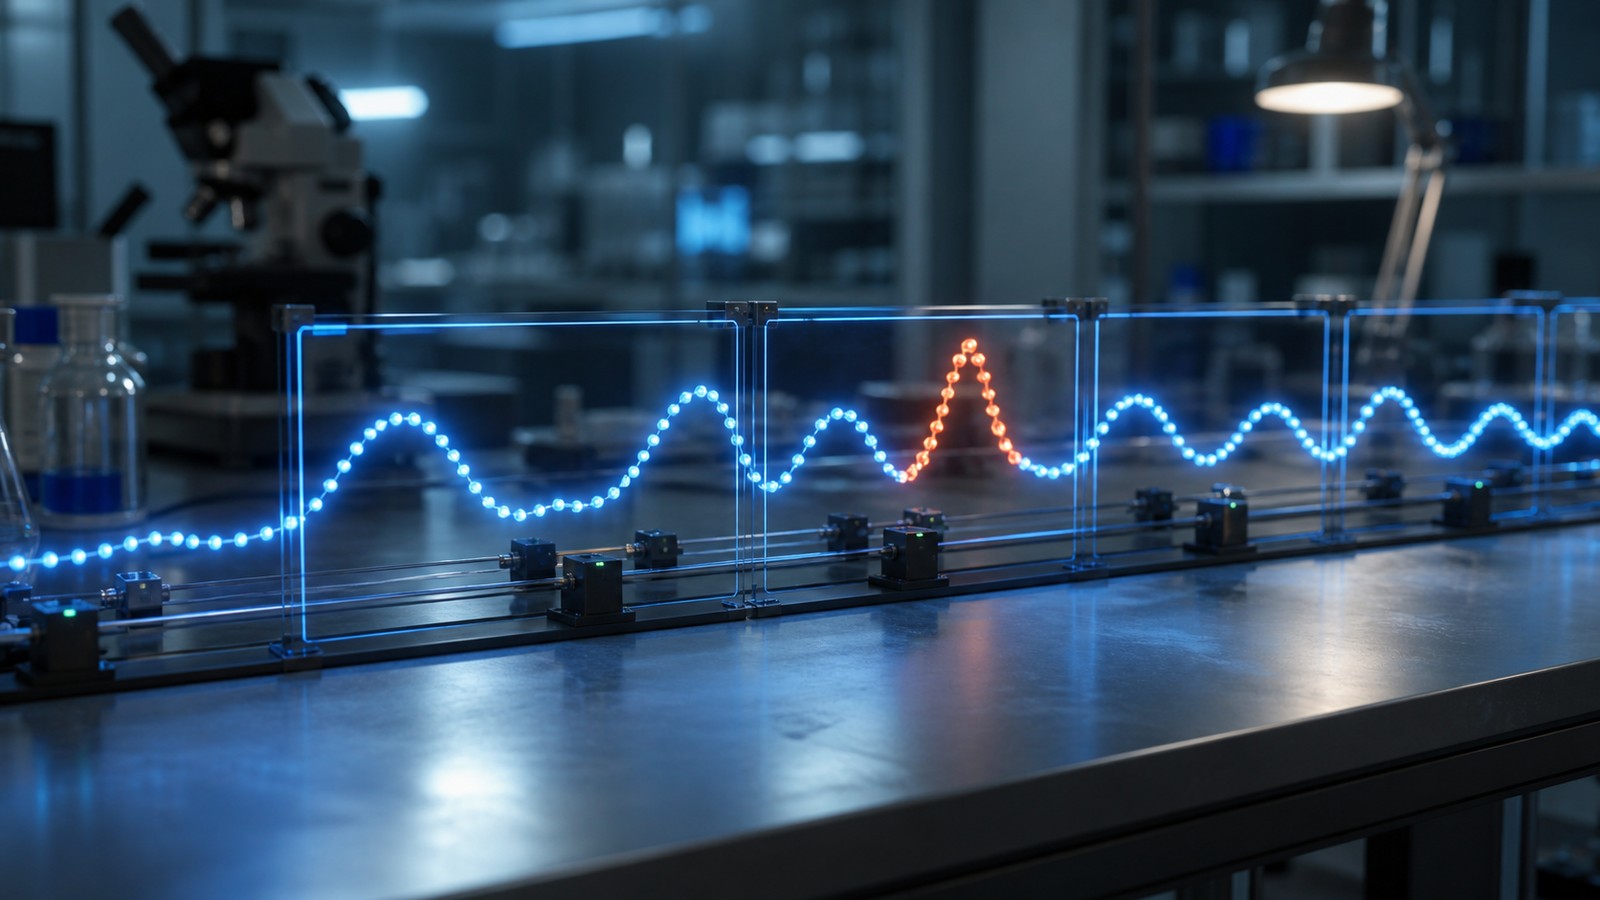
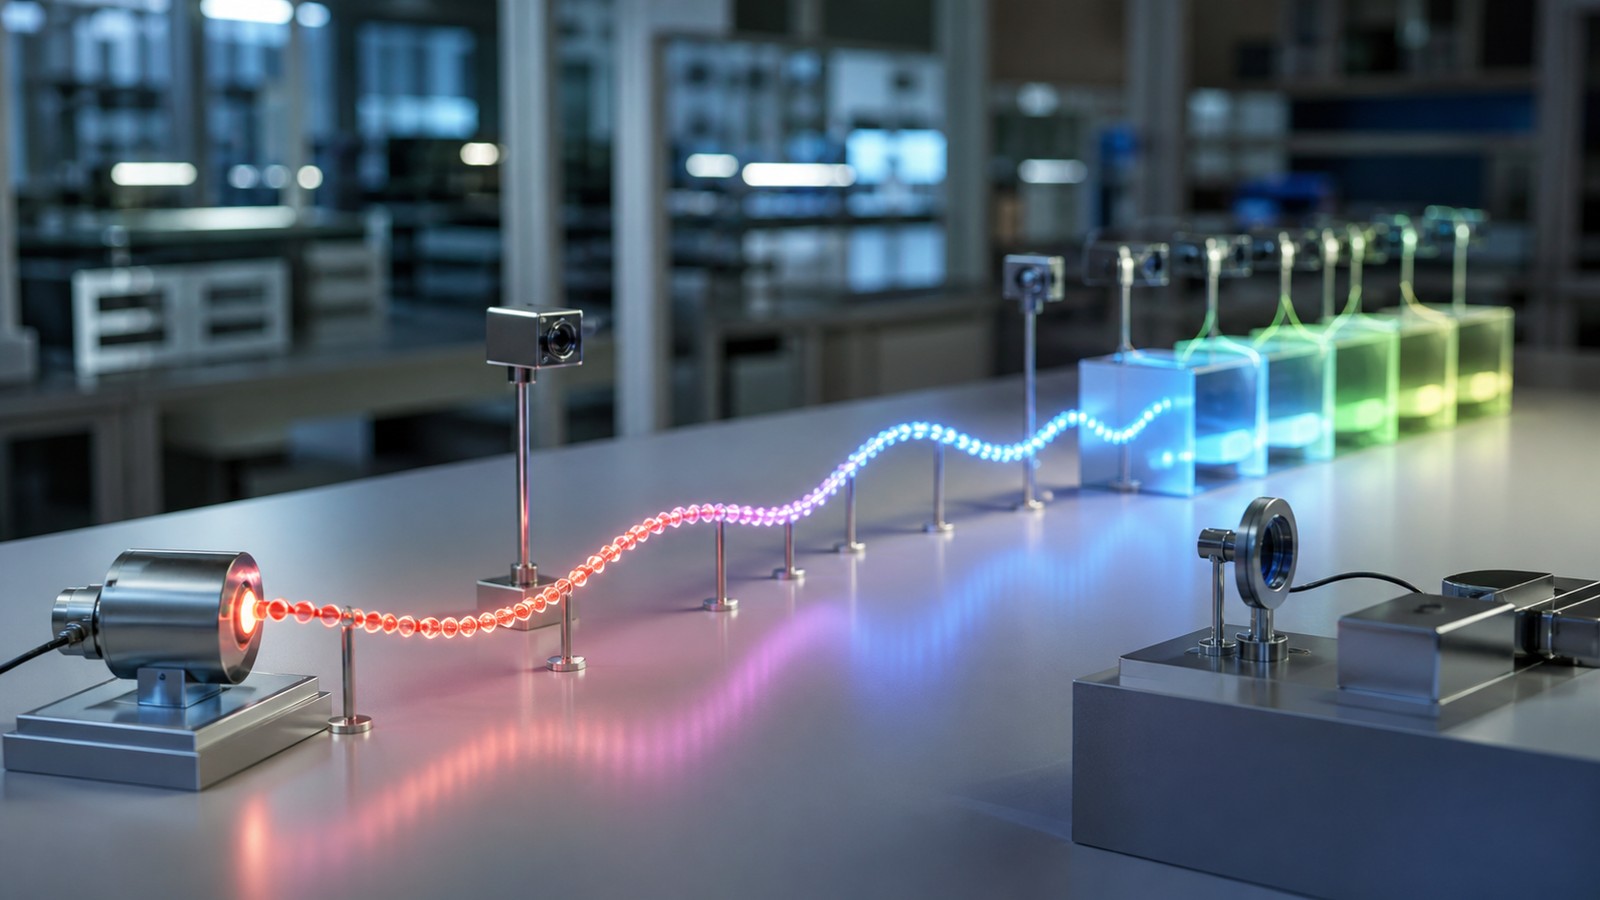
Time-series data records measurements in the order they happen. In wireless and electrical systems, that can include signal strength, voltage, current, latency, frequency, temperature, packet loss, vibration, or error rate over time. The order matters because a value is more useful when the system knows when it occurred, what came before it, and what changed afterward. Time-series data turns isolated readings into a pattern.
The Order Carries Meaning
time-series signal data depends on more than individual values. The order of readings helps explain how the ordered signal reading changes.
A reading that looks normal alone may matter when it follows a spike, gap, or drift. Sequence turns data into context.
Timestamps Anchor the Data
Timestamps show when each reading happened. Without reliable time, the time-series signal system cannot compare events properly.
Good timestamps support trend review, delay measurement, correlation, and root-cause work. Time is part of the evidence.
Intervals Should Be Clear
Intervals describe the spacing between readings. Some systems sample evenly, while others record only when events occur.
The interval changes interpretation. A one-second gap and a one-hour gap should not be treated the same way.
Sampling Rate Sets Detail
Sampling rate decides how often measurements are captured. Fast changes need faster sampling.
If sampling is too slow, the system can miss short events. If it is too fast, it may add storage and processing cost.
Baselines Define Normal
A baseline describes expected behavior for a device, channel, sensor, or time period.
Baselines make changes easier to see. They help the time-series signal system separate ordinary variation from meaningful movement.
Trends Show Direction
A trend shows whether readings are moving upward, downward, or staying stable over time.
Trends can reveal wear, congestion, warming, signal weakening, or improving conditions. Direction often matters as much as the current value.
Cycles Show Repetition
Some signals repeat by hour, day, season, workload, or operating mode.
Recognizing cycles helps prevent false alarms. A regular busy-hour pattern should not be mistaken for a random failure.
Spikes Need Context
A spike can show a real event, a temporary overload, interference, or measurement error.
The team should compare spikes with surrounding readings and related signals. One point rarely tells the whole story.
Gaps Are Evidence Too
Missing readings can point to device failure, packet loss, storage issues, power problems, or blocked measurement.
A gap should not be ignored. The absence of data can be part of the signal story.
Drift Can Be Slow
Drift happens when readings slowly move away from earlier behavior.
Slow change may not trigger a dramatic alert, but it can still show aging hardware, calibration problems, or changing conditions.
Noise Can Hide Patterns
Noise adds unwanted variation that makes trends, events, and boundaries harder to see.
Noise-aware analysis should reduce confusion without erasing the useful pattern. That balance is central to time-series signal data.
Filtering Must Be Careful
Filtering can smooth noisy readings or isolate a useful band, but it changes the data.
Filter choices should be documented and tested. A filter should not remove the event the system needs to catch.
Moving Averages Smooth Volatility
A moving average can make a rough signal easier to inspect by smoothing short-term variation.
Smoothing helps with trends, but it can hide sudden events. The window length should match the task.
Rolling Windows Support Comparison
Rolling windows let the system compare recent behavior with earlier behavior.
They help detect short-term changes while preserving time order. The window should be long enough to be meaningful.
Outliers Need Review
Outliers may be errors, rare events, or early warnings.
Removing outliers too quickly can hide important evidence. They should be reviewed before being discarded.
Thresholds Turn Data Into Alerts
Thresholds decide when a reading, trend, or noise level becomes an alert.
Thresholds should reflect the cost of false alarms and missed events. They should be tested against real outcomes.
False Alarms Cost Attention
Too many false alarms can make people ignore the time-series signal system.
Precision matters when alerts create work. An alert should be worth checking.
Missed Events Carry Risk
A system can also fail by missing a real event, drift, or noise problem.
Recall matters when the signal supports maintenance, safety, reliability, or security. Rare cases need deliberate testing.
Latency Changes Usefulness
Latency is the delay between measurement and result. A late alert may be less useful even when it is accurate.
Timing should be measured through the full pipeline. Collection, transfer, processing, and display all add delay.
Correlation Needs Caution
Two signals may move together without one causing the other.
Correlation can guide investigation, but it should not be treated as proof. Context and follow-up tests still matter.
Multiple Signals Can Confirm Change
A pattern is stronger when related signals support it. A latency spike, packet loss rise, and weak signal reading together tell a clearer story.
Combined evidence helps avoid quick conclusions. It also makes troubleshooting more targeted.
Segment Testing Finds Weak Spots
Overall performance can hide weak behavior in certain devices, times, sites, or conditions.
Segment testing shows where the model works and where it needs more support. Averages can hide trouble.
Stress Testing Shows Limits
Stress tests use noisy readings, missing data, short events, and unusual patterns.
These tests reveal where the time-series signal system becomes fragile. They help define fallback rules before deployment.
Forecasting Needs Honest Splits
Forecasting should be tested on future-like data, not on examples that leak future information into training.
Time-aware validation protects trust. It shows whether the model can handle what comes next.
Anomaly Detection Needs Baselines
An anomaly is unusual only compared with an expected pattern.
The baseline should fit the device, site, or time period. A generic baseline can create weak alerts.
Feature Engineering Helps Models
Time-series features can summarize slopes, averages, ranges, gaps, peaks, cycles, and noise levels.
Good features make patterns easier for models to learn. They should still preserve useful meaning.
Visualization Helps People See Change
Charts can make trends, gaps, spikes, and cycles easier to recognize.
A useful chart needs clear scale, units, and time range. A misleading chart can create the wrong conclusion.
Logs Make Results Traceable
Logs should preserve key readings, timing, confidence, thresholds, and version details.
Traceable logs help teams investigate mistakes. They also support audits and maintenance.
Version Control Protects Comparisons
Changes in sampling, filtering, thresholds, or formulas can change results.
Version control makes those changes visible. It helps teams compare old and new behavior fairly.
Data Retention Needs Rules
Teams should decide how long to keep raw readings, summaries, alerts, and logs.
Retention rules preserve needed evidence while limiting clutter and risk. They should match the purpose of the system.
Privacy Can Still Matter
Time-series and noise data can reveal behavior, location, routines, or operational patterns.
Privacy should guide collection, access, and retention. Useful analysis should not collect more sensitive detail than needed.
Security Protects the Evidence
Tampered devices, spoofed readings, and insecure logs can damage trust in the signal.
Security should cover measurement, transfer, storage, processing, and update paths. Bad data leads to bad decisions.
Human Review Adds Judgment
Some outputs need human review, especially when confidence is low or consequences are meaningful.
Review rules keep the system practical. They prevent automated analysis from carrying more responsibility than it should.
Operational Fit Is the Test
The result should support a real action such as inspect, retest, tune, repair, monitor, or escalate.
If the output does not guide a next step, the analysis needs more work. Practical value is the goal.
Maintenance Keeps Patterns Current
Signals change as devices age, environments shift, and workloads evolve.
Maintenance keeps time-series signal data aligned with current conditions. It includes monitoring, calibration, threshold review, and updates.
Final Takeaway
time-series signal data is strongest when time order, signal quality, context, and action rules work together.
The goal is to understand how wireless and electrical signals change over time. Strong signal intelligence makes change easier to understand and easier to act on.
Small Settings Can Change Results
A small change in sampling rate, window length, filter setting, or threshold can alter the output.
Those settings should be treated as real design decisions. They deserve testing and documentation.
Periodic Review Catches Drift
Periodic review checks whether baselines, sensors, thresholds, and assumptions still match current conditions.
That review keeps the system from aging quietly. It protects the value of the analysis over time.
Clear Language Helps Users Act
Outputs should use plain language that names the pattern without overstating certainty.
Plain wording helps people respond proportionally. It turns signal analysis into guidance rather than mystery.
Examples Should Match Reality
Training and testing examples should resemble the conditions where the system will operate.
If examples are too clean or narrow, the time-series signal system may look stronger than it really is.
Difficult Cases Deserve Review
Difficult cases include weak readings, brief events, crowded channels, strong noise, and unusual timing.
Those cases often reveal the most useful limits. They should be reviewed before the system is trusted broadly.
Action Rules Close the Loop
The output should connect to action rules such as inspect, retest, filter, tune, repair, or keep monitoring.
Those rules close the loop between analysis and work. They make time-series signal data useful beyond the chart.
Model Updates Need Comparison
When the model or rule changes, teams should compare old and new behavior on the same examples.
This catches regressions. It also shows whether the change improved the decision or only changed the score.
Quality Scores Help Interpretation
A quality score can show whether the current reading is strong, weak, noisy, missing, or outside the expected range.
Quality scores keep confidence honest. They help users know when the output needs extra review.
Dashboards Should Stay Focused
A dashboard should highlight the few patterns that drive decisions rather than every available metric.
Focused displays reduce confusion. They help teams notice the change that matters most.
Handovers Need Notes
A handover should explain sampling, baselines, thresholds, known weak spots, and common failure signs.
Good notes help the next team maintain the time-series signal system. They also reduce repeated troubleshooting.
Final Use Check
Before acting on the output, the team should ask what changed, how strong the evidence is, and what action is reasonable.
That final check keeps interpretation grounded. It helps the system support judgment instead of replacing it.
Long-Term Review Protects Value
Long-term review checks whether devices, channels, environments, and usage patterns still match the assumptions behind the analysis.
This protects time-series signal data from becoming stale. It also helps teams catch slow changes before they become normal.
Evidence Should Stay Checkable
Important outputs should keep enough evidence for later review, including time, value, threshold, confidence, and related readings.
Checkable evidence helps teams learn from both correct and incorrect outputs. It makes improvement possible.
Good Systems Stay Humble
A good system reports what the signal supports and leaves room for uncertainty where the evidence is limited.
That humility is practical. It keeps time-series signal data useful, clear, and easier to trust.
Maintenance Completes the System
The work does not end when the first dashboard or alert is published.
Maintenance keeps baselines, thresholds, filters, and review rules aligned with real conditions. That is what makes the time-series signal system durable.
Clear Ownership Helps
Someone should own the review of alerts, settings, and recurring signal problems.
Clear ownership keeps the time-series signal system from becoming unattended background noise.
Final Practical Standard
The practical standard is simple: the signal view should help people understand change and choose the next step.
When that standard is met, time-series signal data becomes useful rather than decorative.