Time-Series Signals Show How Patterns Change
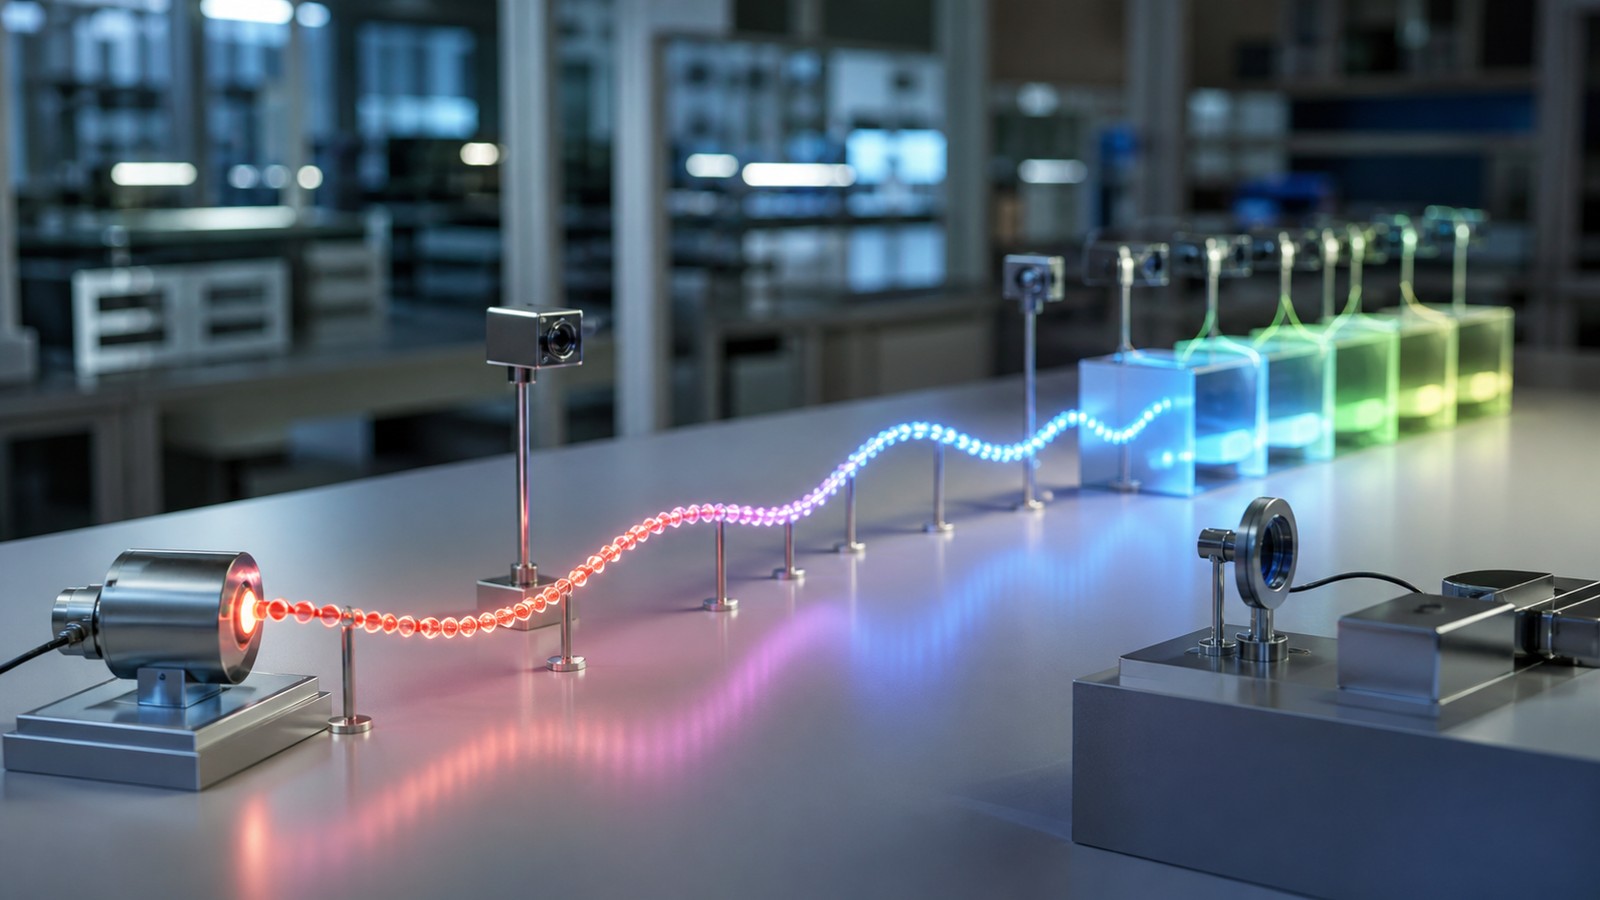
Time-series signals are measurements collected in order over time. They can show temperature, vibration, voltage, audio, wireless quality, traffic, heart rhythm, machine load, user activity, or any other changing process. AI systems use time-series data to detect trends, cycles, anomalies, delays, and early warning patterns. The order matters because the meaning of each reading depends on what came before it, what happens next, and how quickly conditions change.
Order Is the Main Difference
A time-series signal is not just a list of numbers. The order of the readings carries meaning.
If the readings are shuffled, trends, cycles, delays, and events may disappear. Time is part of the signal.
Sampling Rate Controls Detail
Sampling rate describes how often measurements are taken. Fast-changing signals need faster sampling than slow-changing signals.
If sampling is too slow, important events can be missed. If it is too fast, storage and processing demands may grow without much benefit.
Trends Show Direction
A trend is a long-term movement upward, downward, or sideways. Trends can show wear, growth, recovery, drift, or gradual change.
AI can use trends to forecast future behavior, but it should separate true trends from temporary movement.
Cycles Repeat Over Time
Many time-series signals have cycles. Daily traffic, weekly demand, seasonal energy use, rotating machinery, and heartbeats can all repeat.
Recognizing cycles helps models avoid false alarms. A pattern may be unusual at one time and normal at another.
Seasonality Adds Context
Seasonality is a repeating pattern tied to time periods such as hours, days, months, or seasons.
Models need seasonality when normal behavior changes predictably. A winter signal may not match a summer baseline.
Anomalies Break Expectations
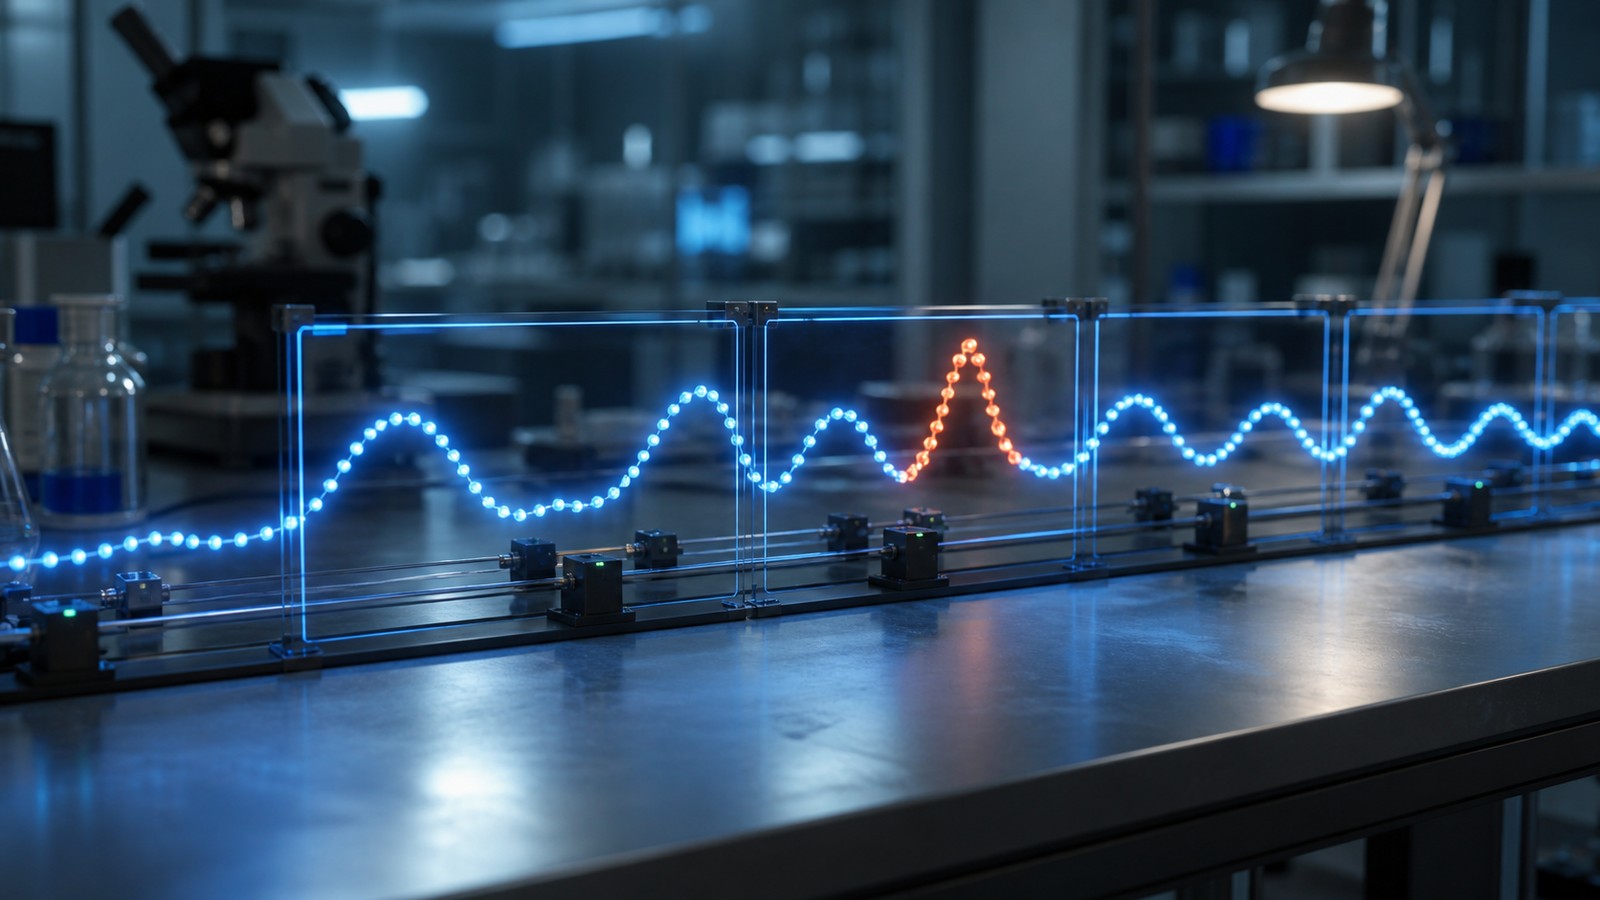
An anomaly is a reading or pattern that does not fit the expected behavior. It may be a spike, drop, gap, drift, or strange sequence.
Anomalies should be reviewed with context. Not every unusual point is a problem, but it may deserve attention.
Noise Hides Patterns
Noise is random or unwanted variation in the signal. It can make trends and anomalies harder to see.
Smoothing and filtering can help, but they should not erase important events. The method should match the decision.
Missing Data Needs a Plan
Time-series data often has gaps from sensor outages, network problems, power loss, or logging errors.
Missing data should be flagged instead of ignored. A gap can be meaningful on its own.
Lag Shows Delayed Effects
A lag occurs when one signal changes after another. For example, temperature may rise before equipment stress appears.
Lag features help models connect cause and effect over time. They are useful in prediction and diagnosis.
Rolling Features Summarize Windows
Rolling averages, rolling maximums, rolling variation, and rolling counts summarize recent history.
These features help models understand local behavior without storing every raw value in the decision.
Change Points Mark Shifts
A change point is a moment when the signal begins behaving differently. It may show a new mode, fault, repair, or environment.
Detecting change points helps teams understand when the old baseline no longer applies.
Forecasting Estimates What Comes Next
Forecasting uses past signal behavior to estimate future values or risk.
A forecast should include uncertainty. Future behavior is never guaranteed, especially when conditions change.
Classification Labels Sequences
Some models classify entire time segments. A segment may be normal, faulty, active, idle, congested, or risky.
Sequence labels should line up with the time window being classified. Poor alignment weakens learning.
Multivariate Series Add Context
Many systems collect several time-series signals together. Temperature, vibration, current, and sound may describe the same machine.
Comparing signals can reveal patterns that one series alone would miss. Alignment and sensor quality become important.
Visualization Helps Understanding
Charts make time-series behavior easier to inspect. A line chart, heatmap, or overlay can reveal trends and anomalies quickly.
Good visualization shows time, units, gaps, events, and baselines clearly. It should support review, not decorate the data.
What to Check Next
Teams should check sampling rate, missing data, time alignment, seasonality, noise, anomalies, and the decision the signal supports.
They should also compare model outputs with real outcomes. A time-series model is useful when it improves timing or judgment.
Deployment Notes
Deployment should monitor data freshness, sensor health, drift, missing values, and forecast error.
Time-series systems should be reviewed after equipment changes, schedule changes, seasonal shifts, and model updates.
Practical Review
A practical review asks whether the time-series view made change easier to understand. The model should reveal timing, pattern, or risk more clearly.
If the output does not help someone decide what to do next, the analysis needs a sharper purpose.
Common Mistakes
A common mistake is treating time-series data like independent rows. Another is ignoring missing values or using future data during training.
Avoiding these mistakes keeps evaluation honest. The model should learn from past and present evidence, not from information it would not have had.
Final Takeaway
Time-series signals show how patterns change over time. They help AI detect trends, cycles, anomalies, and forecasts that depend on order.
The strongest time-series systems use clean timing, useful windows, context, and review against real outcomes.
Time Stamps Need Accuracy
Time-series analysis depends on accurate time stamps. If clocks drift or data arrives out of order, patterns can be misread.
Clock quality matters in sensor networks, logs, industrial systems, and wireless monitoring. Timing errors can look like signal errors.
Events Add Explanation
Events such as maintenance, storms, deployments, firmware updates, or schedule changes can explain shifts in the series.
Tagging events helps models distinguish real anomalies from expected changes. It also makes review easier.
Forecast Horizons Matter
A forecast horizon defines how far ahead the model predicts. Short horizons support control, while longer horizons support planning.
The horizon should match the response. A forecast is useful only if it arrives early enough to act.
Evaluation Must Respect Time
Training and testing should respect chronological order. Using future data to predict the past makes results look better than they are.
Time-aware evaluation keeps the model honest. It shows how the system would perform in real use.
Final Time-Series Review
A final review should ask whether the analysis improves timing, detection, or understanding.
The value of time-series AI is not the chart itself; it is the earlier, clearer decision the chart supports.
Data Freshness Matters
Time-series systems often depend on fresh data. A forecast or alert based on stale readings may be technically valid but operationally useless.
Freshness checks should be part of deployment. They help teams know whether the model is seeing the current system or an old snapshot.
Granularity Changes the Story
Hourly, daily, weekly, and second-by-second views can tell different stories. A daily average may hide a five-minute outage or spike.
The right granularity depends on the decision. Monitoring, planning, and diagnosis may each need different views.
Outliers Need Context
An outlier can be a real event, a sensor error, a logging issue, or a rare but valid condition.
Teams should avoid deleting outliers automatically. The unusual point may be the event the system needs to learn from.
Smoothing Has Tradeoffs
Smoothing can reveal trends by reducing noise, but it can also hide sharp changes and short events.
The smoothing method should match the task. A maintenance forecast and a safety alert may need different treatment.
Multiple Series Need Alignment
When several time-series signals are compared, their timestamps must line up. Misalignment can create false relationships.
Alignment is especially important in sensor fusion, industrial monitoring, and network logs. Timing errors can look like system behavior.
External Variables Add Meaning
External variables such as weather, holidays, operating mode, workload, or maintenance events can explain time-series changes.
Including these variables can improve forecasts and reduce false alarms. They give the model more context than the signal alone.
Backtesting Shows Realistic Performance
Backtesting evaluates a model by pretending to move forward through history and predict future points.
This is more honest than random splitting for many time-series tasks. It respects the order that real deployment would have used.
Dashboards Should Show Baselines
A time-series dashboard is easier to read when it shows expected ranges or baselines alongside current values.
Baselines help users see whether a change is ordinary, unusual, or urgent. They turn a line chart into decision support.
Final Time-Series Takeaway
Time-series work is strongest when the model respects order, timing, context, and operational purpose.
The goal is not just to chart change, but to understand it early enough to act.
Stationarity Affects Modeling
Some time-series methods assume the signal behaves in a stable way over time. Many real systems do not stay perfectly stable.
When behavior changes, teams may need transformations, local baselines, or models that adapt. Ignoring nonstationary behavior can weaken forecasts.
Autocorrelation Shows Memory
Autocorrelation measures how a signal relates to its own past values. It can reveal repeating structure and persistence.
This matters because many time-series signals have memory. The recent past often helps estimate the near future.
Cross-Correlation Compares Signals
Cross-correlation compares timing relationships between two series. It can show whether one signal tends to move before another.
This is useful for diagnosis and prediction. A leading signal can become an early warning for a later outcome.
Resampling Changes Evidence
Teams may resample data from seconds to minutes or hours to simplify analysis. This can help, but it can also hide short events.
Resampling should be chosen carefully. The new interval should preserve the patterns that matter for the decision.
Forecast Error Should Be Tracked
Forecasts should be evaluated after real outcomes arrive. Error tracking shows whether the model remains useful.
Error should be reviewed by condition, not only as one average number. A model may work well in normal periods and poorly during stress.
Alerts Need Context Windows
A time-series alert should include the recent signal path, baseline, threshold, and related events where possible.
Context helps responders avoid overreacting to a single point. It shows whether the change is sudden, gradual, repeated, or isolated.
Anomaly Detection Needs Timing
An anomaly in a time series can be a single point, a short sequence, or a slow pattern that only becomes clear later.
Detection logic should match the anomaly type. A spike detector and a drift detector are not the same tool.
Time-Series Value Is Practical
The value of time-series analysis appears when a team understands change earlier than before. That may mean earlier maintenance, better forecasts, or fewer false alarms.
A chart is only the beginning. The useful result is a decision that arrives with better timing and clearer evidence.
Final Sequence Takeaway
Time-series signals are powerful because they preserve order. The order shows direction, rhythm, delay, and surprise.
Good analysis respects that order from data collection through evaluation. That discipline keeps the model honest.
Operational Timing Shapes Value
A time-series alert or forecast should match the pace of the operation. A factory line, wireless network, battery system, and weather station all need different timing.
This is why the response window matters. The analysis is useful when it arrives early enough and clearly enough for people or systems to act.
History Should Be Long Enough
A model needs enough history to learn ordinary variation. Too little history can make normal seasonal or weekly patterns look surprising.
Too much irrelevant history can also hurt when the system has changed. Teams should choose a history window that reflects current reality.
Time-Series Models Need Monitoring
After deployment, teams should monitor forecast error, data gaps, drift, and alert outcomes. These checks show whether the model is still useful.
The model should not quietly age out of relevance. Changing systems need changing baselines, features, and review habits.
Better Timing Improves Decisions
The practical promise of time-series analysis is better timing. Teams can see change earlier, compare it with past behavior, and respond before the pattern becomes harder to manage.
That timing advantage is the reason to preserve order carefully. Without time, the signal loses much of its meaning.